The market volatility continues. How to determine when the pullback is over?

Original Author: Murphy, On-chain Data Analyst
How to Determine if a Pullback is About to End?
There are many methods to determine if a short-term pullback is about to end. As mentioned before, analysis can be conducted from different perspectives such as chip structure, financial pressure, sentiment feedback, etc. Today, I will share another method that I often use and find very effective, which is to observe the cost basis changes of different time cohorts as a reference point.
Before discussing the logic, let's first look at a case study—the bottom judgment of a large cycle
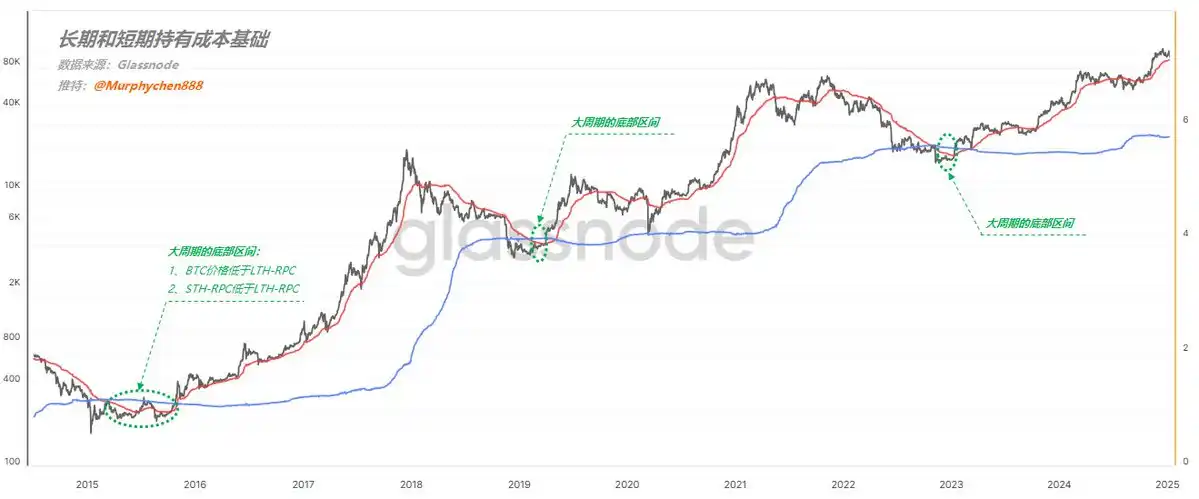
In Figure 1 below, the blue line represents Long-Term Holder's Average Cost Basis (LTH-RPC), the red line represents Short-Term Holder's Average Cost Basis (STH-RPC), and the black line is BTC's price.
(Figure 1)
Pay attention to the area I have circled in green with a dotted line. As long as the following 2 conditions are met simultaneously:
- Condition 1, BTC price is below LTH-RPC
- Condition 2, STH-RPC is below LTH-RPC
This stage is the bottom range of the large cycle and is also an excellent opportunity to buy the dip!
The underlying logic is as follows:
First, when the BTC price falls below the LTH-RPC, it means that the average cost of long-term holders is at a loss. This indicates that the price is severely undervalued, and the market bubble has almost completely burst.
Second, in the vast majority of time, the longer the chip holding period, the lower the relative cost. Therefore, it is extremely rare for STH-RPC to be lower than LTH-RPC.
It indicates that during the price decline, there were a large number of loss-exiting short-term holders, but new short-term holders entered to buy the dip. After frequent turnover, the cost of short-term chips was actually pulled below the cost of long-term chips. This is a phase of oversold prices, signaling the bottom of the panic sentiment. Following the logic above, we can also apply the same reasoning to determine the duration of a bull market pullback.
Figure 2 below lists the cost bases for: 1d-1w (red line), 1w-1m (yellow line), 1m-3m (blue line), 3m-6m (purple line)

(Figure 2)
First, let's look at February to May 24th, which happens to be the process from the start of a trend to decay and a pullback. The entire process is accompanied by the widening and narrowing of the distance between the blue line and the red line (as indicated by the green arrows in the image);
Eventually, the blue line ran to the top, while the red line was at the bottom, meaning that the relative short-term cost of chips was lower than the relative long-term cost of chips. I call this phenomenon the "reverse arrangement structure" of long-term and short-term costs.
I marked three points in the image with orange dashed lines, all of which show the formation of a blue, yellow, red arrangement from top to bottom, or a purple, blue, yellow, red arrangement, representing the relative bottoms during pullbacks.
So, the current trend is also transitioning from rapid expansion to gradual contraction, but the blue line is still below. If we are to see a market restart in the short term, perhaps a "reverse arrangement structure" needs to be formed first. However, after this period of turnover, the blue line is already very close to the red and yellow 2 lines. As long as there is another period of consolidation, the structure can form, thereby meeting the conditions for forming a relative bottom.
PS: Of course, it would be best to form a purple, blue, yellow, red "reverse arrangement structure," but this would require a longer turnover time (at least 4-5 months).
Summary:
Based on the change in the cost base of different time groups as the basis for judging the time of a pullback, the higher the relative cost of long-term chips, the closer we are to the bottom once a blue, yellow, red "reverse arrangement structure" is formed from top to bottom. This indicates that turnover is sufficient, sentiment is close to the bottom, and the pullback time is coming to an end.
The content shared in this article is for communication and research purposes only and should not be construed as investment advice.
You may also like

The large models in the United States are moving towards closure in the name of security

Morning Report | CoinEx becomes a key hub for Iran to evade sanctions, involving over $3.8 billion in funds; Kalshi seeks a new round of financing, with a valuation potentially rising to $40 billion

From the white-haired stock god to the billionaire fund mogul, the smart people shorting Nvidia are all getting rich using the same framework

Why do cryptocurrency projects always like to change their names?

Global Launch: As predictions become the most scarce asset in the AI era, Manadia is defining the next generation of the value internet

Who is footing the bill for the $64 billion accounting frenzy?
I never expected that the first application of AI x Crypto would be in security auditing

What is your view on Binance's competitive advantages?

ETH has entered a non-consensus phase, and the turning point is approaching!
The shift in the cloud of the air: from despising stablecoins a year ago to the high-profile entry of capital today
The survival dilemma of small and medium exchanges behind the withdrawal anomalies exposed by AscendEX
Why Is Bitcoin Falling Below $60K? 5 Key Market Drivers Explained
Bitcoin has dropped sharply amid ETF outflows, Strategy stock weakness, AI stock rallies, and changing Fed expectations. Explore the key forces driving BTC’s latest correction and what traders should watch next.

Bitcoin vs. Gold in 2026: Which Asset Performs Better in Different Markets?

Morning News | The draft amendment to the People's Bank of China Law aims to clarify the legal status of digital renminbi; South Korea will transfer about 40 unregistered virtual asset service providers to law enforcement agencies
The cryptocurrency industry has entered the "Show Me" era: merely relying on vision is no longer enough

Interpreting the Ethereum Foundation's new structure: Reaffirming self-sovereignty amid institutional trends
Former SpaceX engineer reconstructs the financial execution system using first principles
